Back to Blogmicroservices-patterns 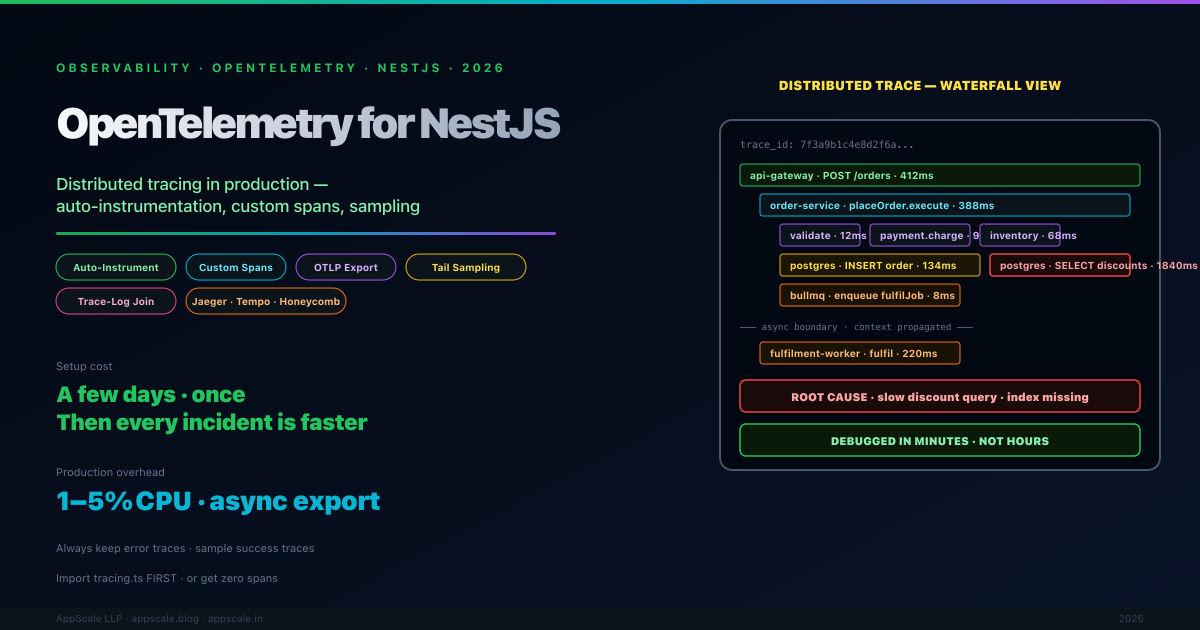
OpenTelemetry for NestJS: Distributed Tracing in Production (2026)
OpenTelemetry NestJS observability distributed tracing OTLP auto-instrumentation custom spans Jaeger Grafana Tempo Honeycomb tail sampling head sampling correlation IDs trace context propagation W3C traceparent Pino logging BullMQ tracing TypeORM tracing production observability